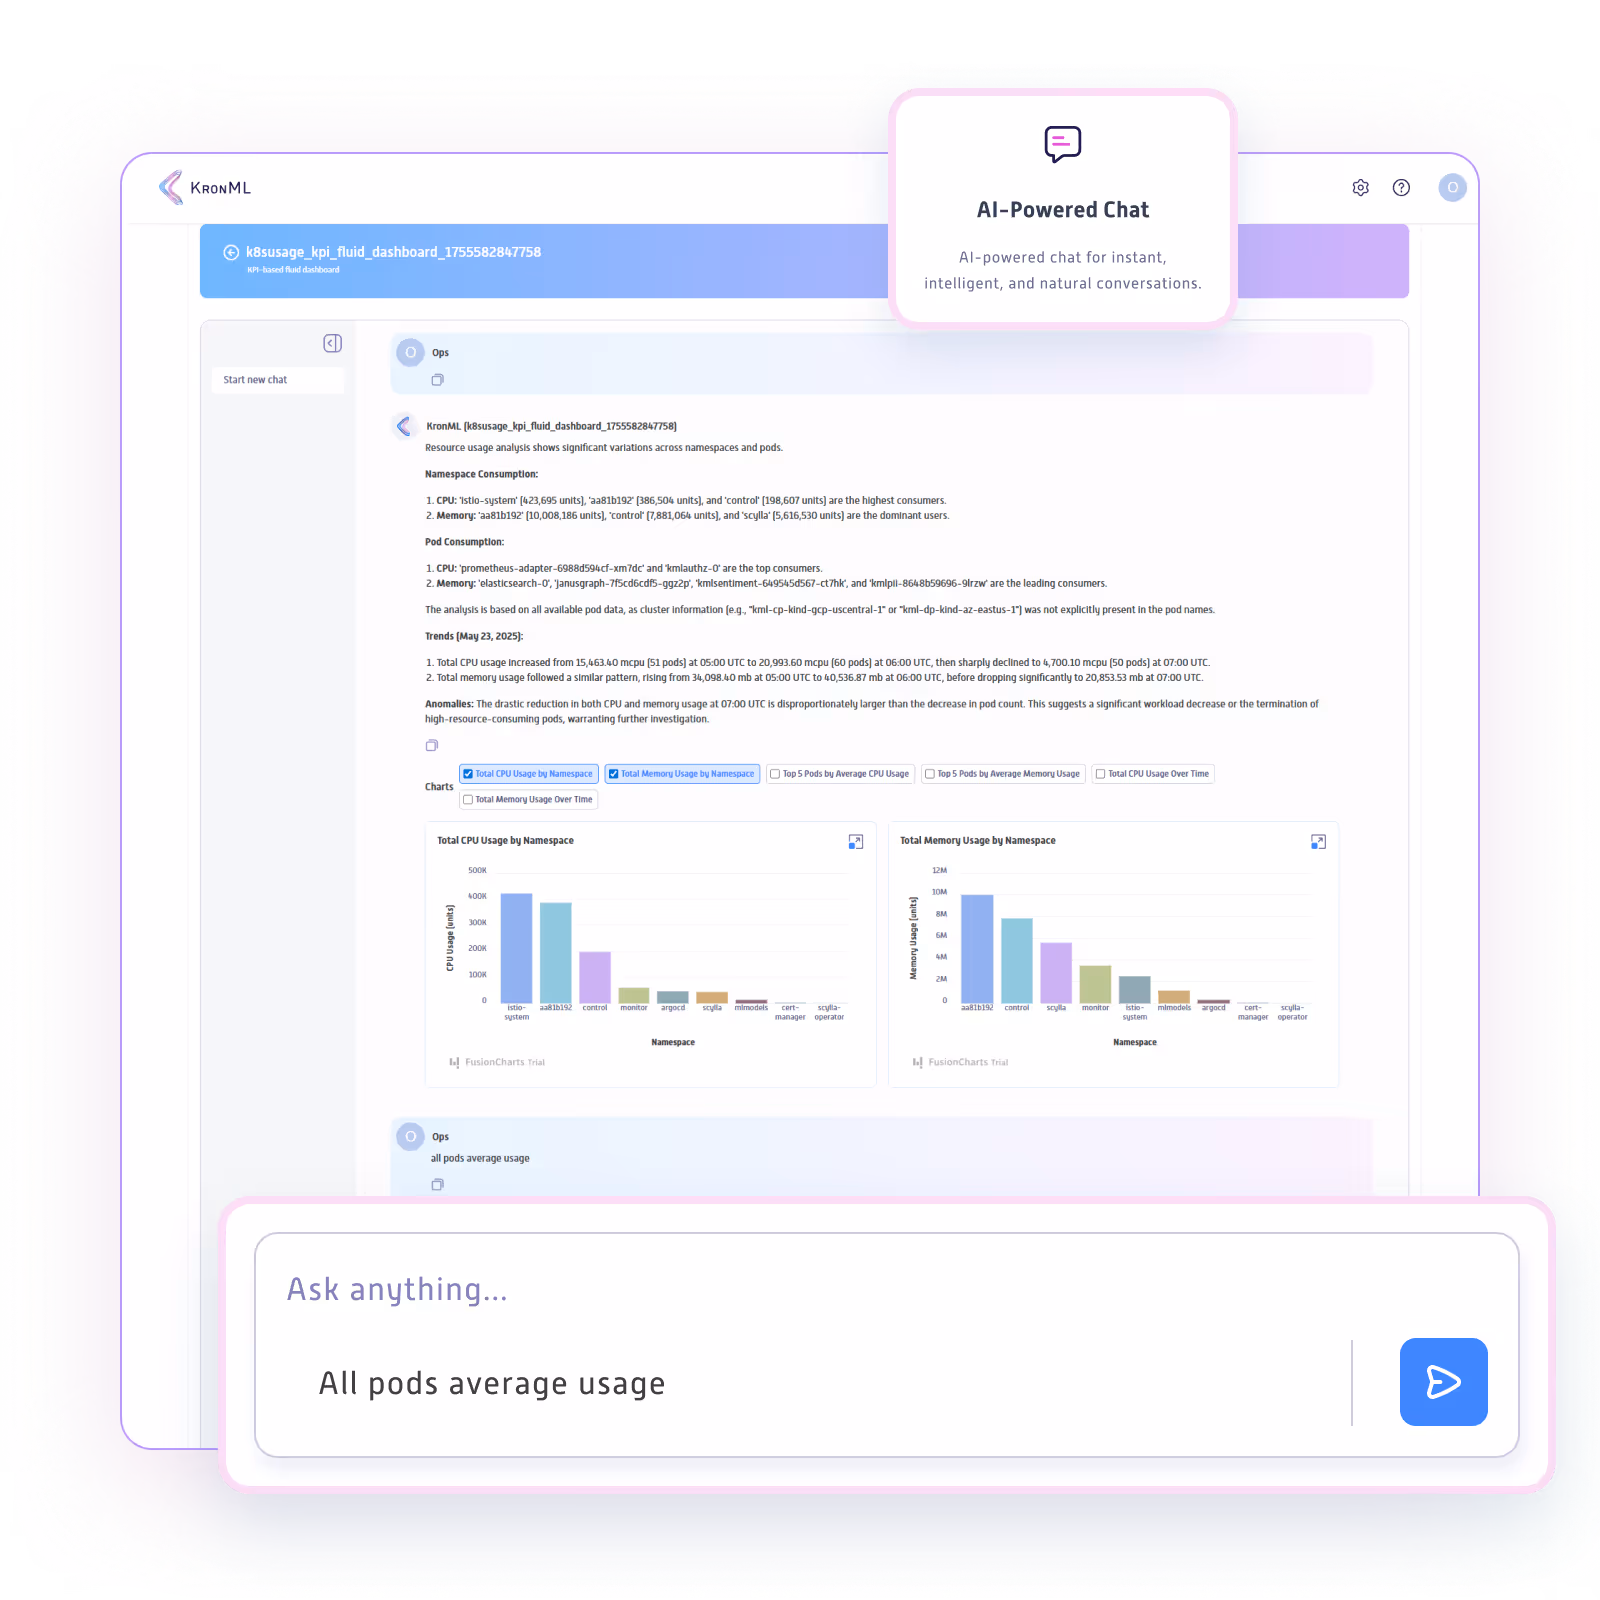
The primary feature is the ability to interact with data using everyday language, eliminating the need for complex queries or technical expertise.

The dashboard can automatically select the most appropriate chart or graph (e.g., a bar chart, pie chart, or line graph) to visualize the data in response to a user's question.
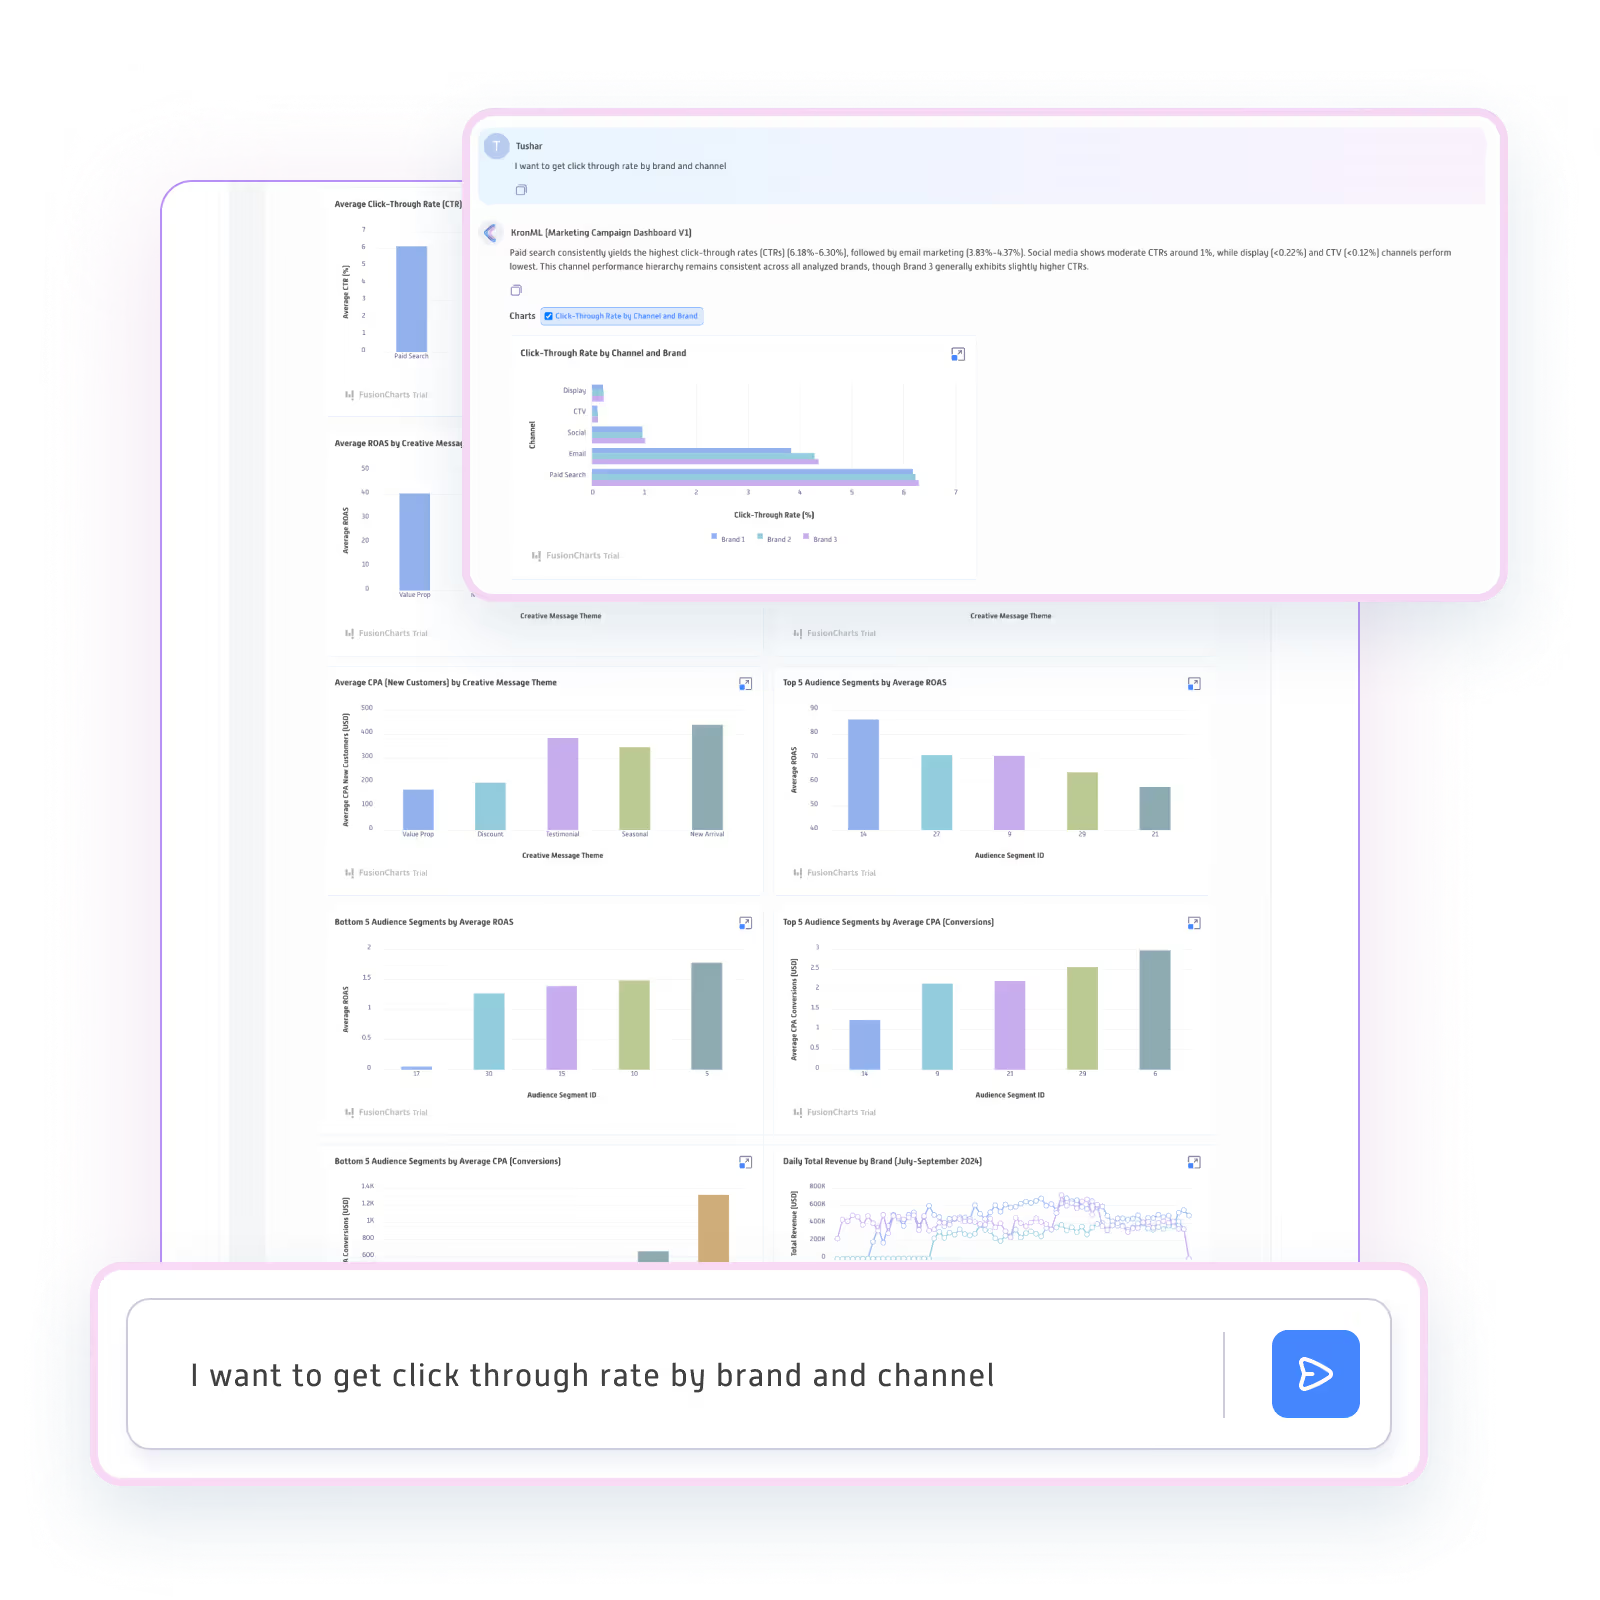
Users can ask follow-up questions to drill down into the data, such as "Show me the top-performing products in that region," creating a personalized and iterative analysis experience.
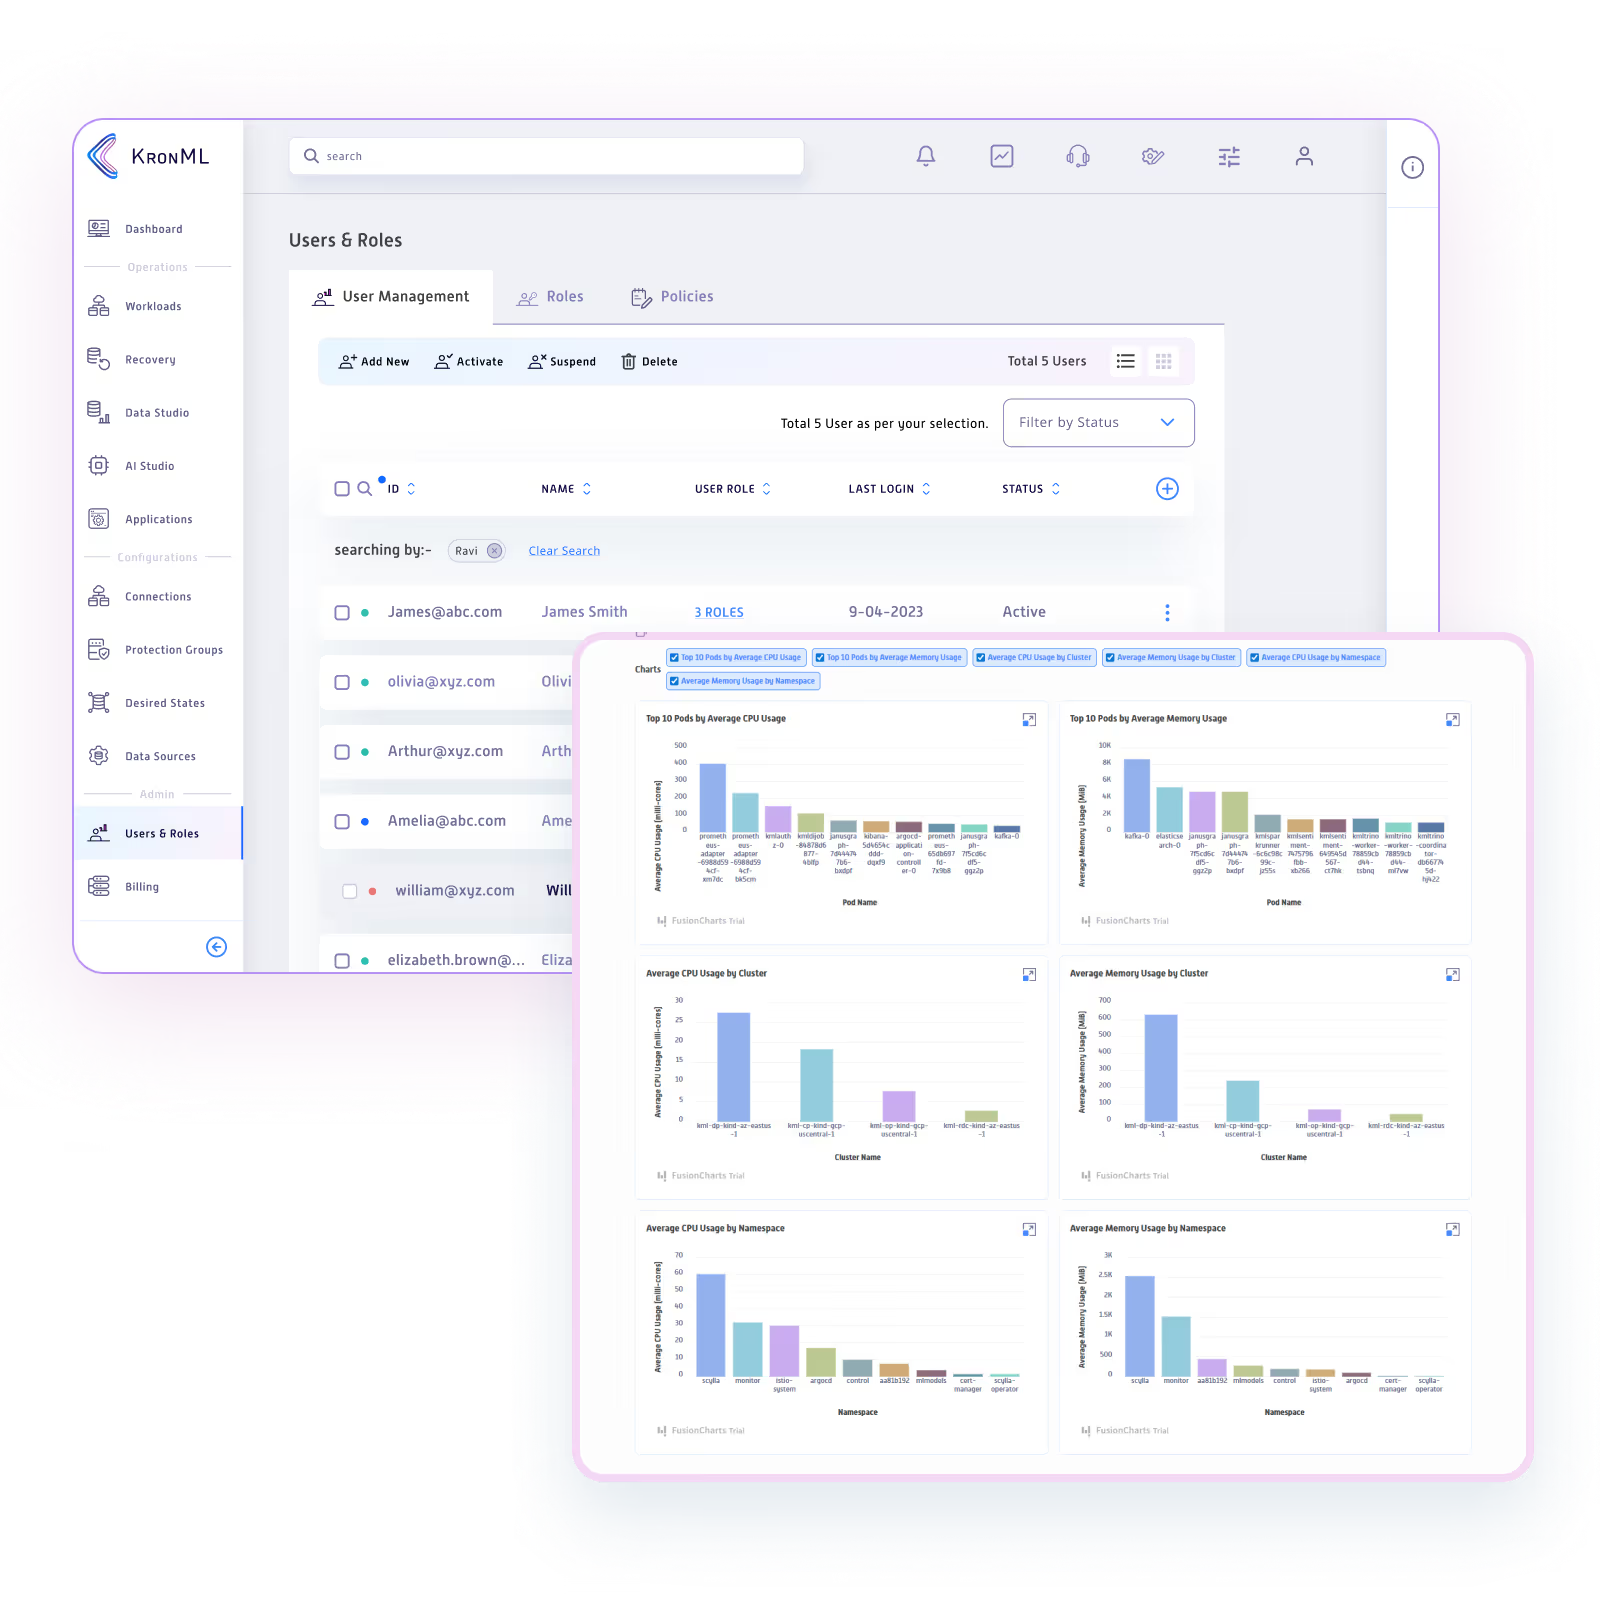
By removing the technical barrier, conversational dashboards empower more people within an organization to get fast answers and make data-driven decisions on their own.